Poly1305-AES speed tables
D. J. Bernstein
Authenticators and signatures
A state-of-the-art message-authentication code
Poly1305-AES speed tables
Speed tables
What do the speed tables mean?
Why is the first cycle count much larger than the typical cycle count?
Why do adjacent lines show different timings?
Speed graphs
Best-case benchmarks
Audiences for this page:
(1) People who want to know how much time message authentication will take.
(2) People who want to compare Poly1305-AES to other authentication functions.
(3) People interested in benchmarking as a general topic:
specifically, in the difference between
best-case benchmarks and thorough benchmarks.
Speed tables
Here are some speed tables printed by my
poly1305aes-speed.c
benchmarking program:
- AMD
Athlon
cpuid AuthenticAMD-00000622-0183f9ff,
900MHz,
using poly1305aes_athlon,
gcc 2.95.4 -O3.
- IBM PowerPC RS64 IV (Sstar),
668MHz (one of eight CPUs),
using poly1305aes_aix.
- IBM PowerPC 970 (G5),
1800MHz,
using poly1305aes_macos.
Warning: The G5 changed the cycle/time-base ratio!
These are time-base counts times 16;
my impression is that the cycle counts on this machine
are time-base counts times 54,
but I haven't had a chance to investigate.
With that caveat, here's the data.
Thanks to Ariel Berkman for running the benchmark.
- Intel Pentium III
cpuid GenuineIntel-00000673-0383fbff,
500MHz,
using poly1305aes_ppro,
gcc 2.95.4 -O3 -mcpu=pentiumpro.
- Intel Pentium III,
850MHz,
using poly1305aes_ppro.
- Intel Pentium III,
1000MHz (one of two CPUs),
using poly1305aes_ppro.
- Intel Pentium 4,
1900MHz,
using poly1305aes_ppro.
- Intel Pentium 4
cpuid GenuineIntel-00000f29-bfebfbff,
3400MHz,
using poly1305aes_ppro,
gcc 2.95.4 -O3 -mcpu=pentiumpro.
- Intel Pentium M
cpuid GenuineIntel-00000695-a7e9f9bf,
1300MHz,
using poly1305aes_ppro,
gcc 2.95.4 -O1.
- Motorola PowerPC 7410 (G4),
533MHz (one of two CPUs),
using poly1305aes_macos.
- Sun UltraSPARC II,
296MHz (one of four CPUs),
using poly1305aes_sparc.
- Sun UltraSPARC IIi,
360MHz,
using poly1305aes_sparc,
gcc 3.0.4 -m64 -O3 -mcpu=ultrasparc.
Had to change %d to %f,
even though SCD 2.4 uses %d for its double-precision registers;
not sure whose fault this is.
- Sun UltraSPARC III,
900MHz (one of eight CPUs),
using poly1305aes_sparc.
Code sizes, assuming padding to 16-byte boundaries:
- Athlon: 6784 instruction bytes
(4864 AES, 1568 Poly1305, 112 clamp, 96 isequal, 80 verify, 64 authenticate)
and 2208 data bytes
(2048 AES, 160 Poly1305).
- Pentium: 5440 instruction bytes
(3520 AES, 1568 Poly1305, 112 clamp, 96 isequal, 80 verify, 64 authenticate)
and 2208 data bytes
(2048 AES, 160 Poly1305).
- PowerPC: 4224 instruction bytes
(2800 Poly1305, 816 AES, 208 verify, 176 authenticate, 144 clamp, 80 isequal)
and 2288 data bytes
(2112 AES, 144 Poly1305, 16 verify, 16 authenticate).
Add a few bytes for TOC entries under AIX.
- UltraSPARC:
5680 instruction bytes
(3744 Poly1305, 1328 AES, 272 isequal, 112 verify, 96 authenticate, 96 clamp, 32 fsr)
and 4288 data bytes
(4144 AES, 144 Poly1305).
What do the speed tables mean?
In the speed tables,
each line reports timings for several consecutive computations,
with an instruction-cache/data-cache flush before the first computation.
The first number in each line is the message length;
then there are symbols indicating what's being computed;
then there are cycle counts for the individual computations,
including timing overhead.
Here are the symbols:
- A: computation of an authenticator;
- V: verification of an authenticator;
- 4444: 16-byte-aligned keys, nonces, messages, and authenticators;
- 0000: unaligned keys, nonces, messages, and authenticators;
- --: consecutive computations use
widely separated keys and widely separated data,
showing the time to load keys and data from DRAM;
- -D: consecutive computations use
widely separated keys but the same data,
showing the time to load keys from DRAM;
- K-: consecutive computations use
adjacent keys in cache and widely separated data,
showing the time to load data from DRAM;
- KD: consecutive computations use
adjacent keys in cache and the same data,
showing what happens if all keys and data fit into L1 cache.
For example, the Pentium-III line
1024 V0000KD 18325 5334 5217 5217 5217 5217 5217 5217 5217 5217 5217 5217 5217 5217 5217 5217 5217 5217 5217 5217
reports timings for several verifications of authenticators
on 1024-byte messages:
18325 CPU cycles for the first verification,
5334 CPU cycles for the second,
5217 CPU cycles for the third, and so on.
The keys, nonces, messages, and authenticators were in cache
but they weren't aligned.
Why is the first cycle count much larger than the typical cycle count?
The first cycle count in each line of the speed table (the third column)
includes the extra time needed
to load the Poly1305-AES code from DRAM:
roughly ten thousand cycles on an UltraSPARC II, for example.
There's a quantum leap in real-world packet-processing performance
when all relevant code fits into cache
(at least L2 cache, preferably L1 cache),
because this DRAM load can be skipped.
This is why code size is important,
although it's difficult to measure the importance
without also seeing the sizes of other pieces of software.
Even after the first column, the timings don't instantly settle down.
One reason is that the AES tables haven't been completely loaded from DRAM.
See my paper on
cache-timing attacks
for further discussion.
Why do adjacent lines show different timings?
Each speed table includes three 1024 V0000KD lines:
     1024 V0000KD 24846  5213  5314  5204  5204  5204  5204  5204  5204  5204  5204  5204  5204  5204  5204  5204  5204  5204  5204  5204
     1024 V0000KD 23589  5709  5207  5207  5207  5207  5207  5207  5207  5207  5207  5207 15287  5207  5207  5207  5207  5207  5207  5207
     1024 V0000KD 18325  5334  5217  5217  5217  5217  5217  5217  5217  5217  5217  5217  5217  5217  5217  5217  5217  5217  5217  5217
The three repetitions are unrolled in the timing program.
The location of a function call in memory can affect performance
(thanks to branch-prediction subtleties, for example)
even when the function is called in exactly the same way.
This causes small differences between lines:
for example, the first line
settles down to 5204 while the third line settles down to 5217.
In theory, a Poly1305-AES user can adjust the position of his function calls
to obtain the best performance.
I generally presume that the user has not done this,
so I report the worst of the three lines
when space prevents me from reporting all of them.
Occasional large burps
(such as the 15287 in the fifteenth column of the second line above)
are caused by the timing computer pausing to do something else,
such as handle a network packet.
These burps have nothing to do with Poly1305-AES performance
and can be safely ignored.
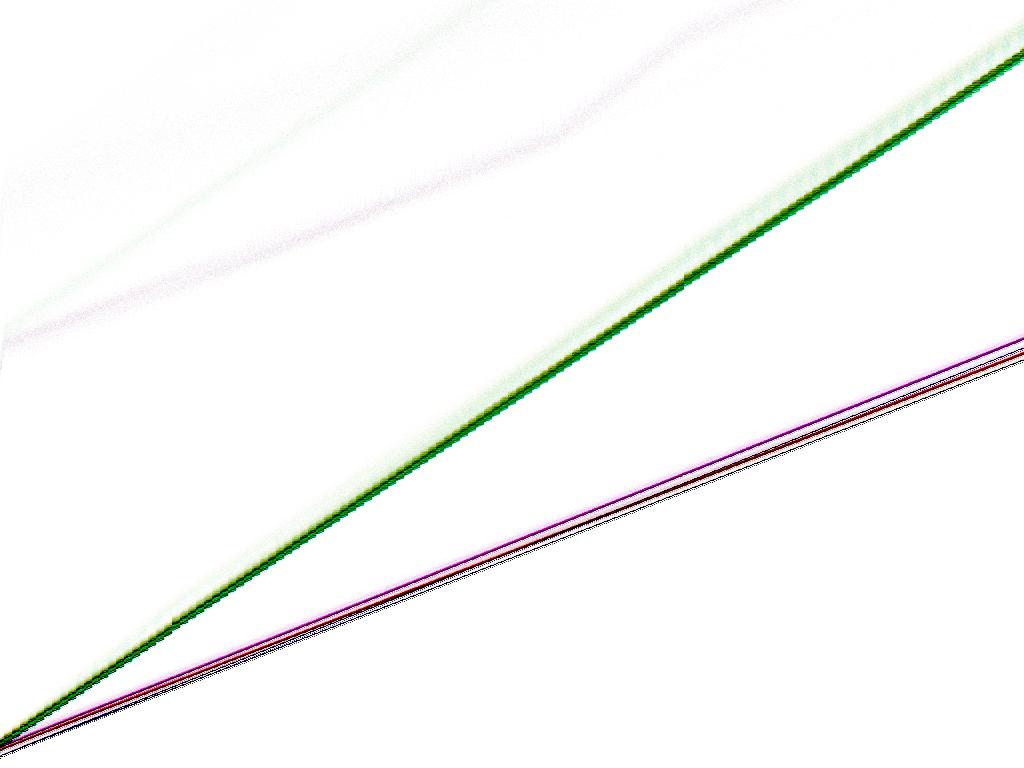
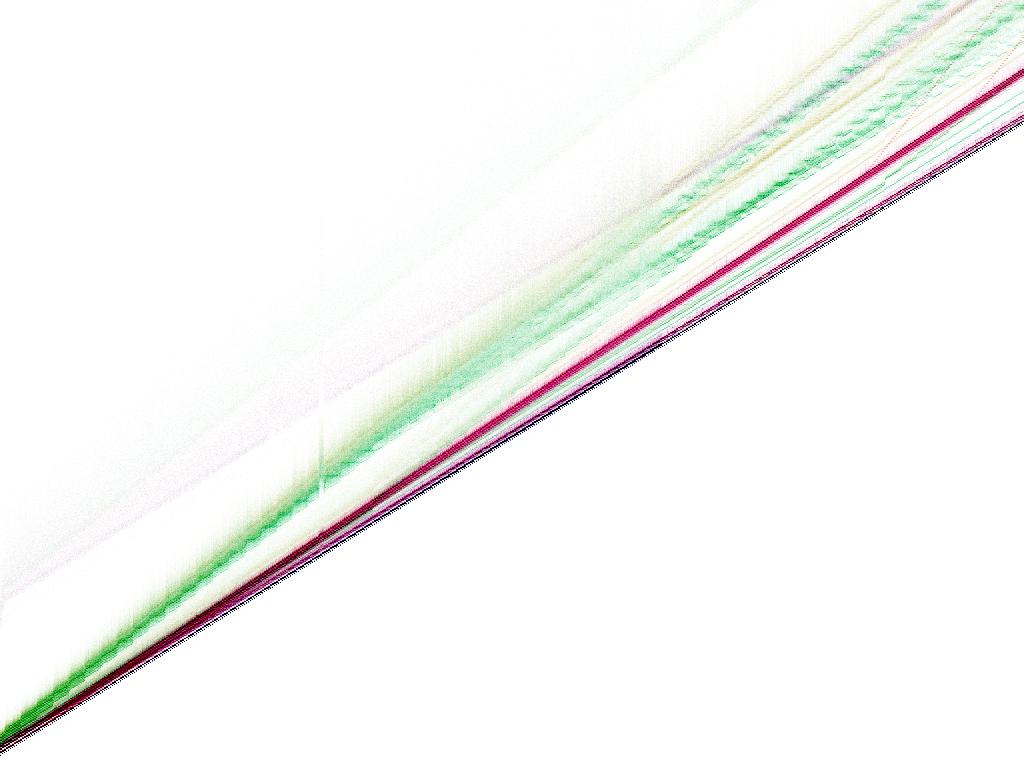
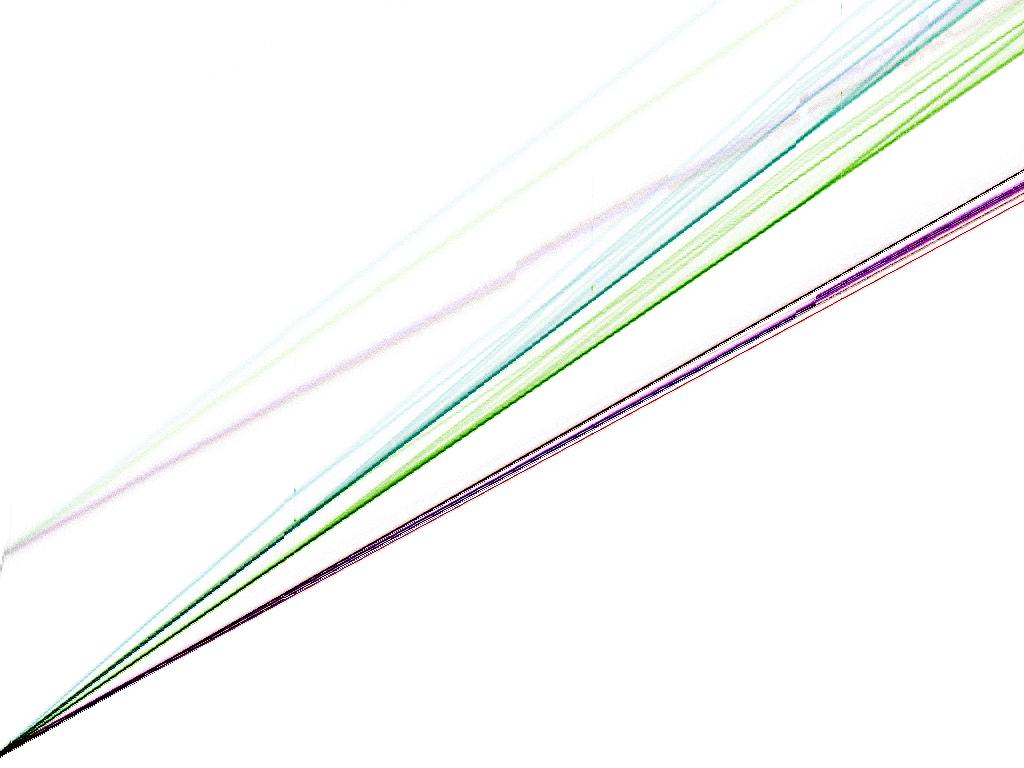
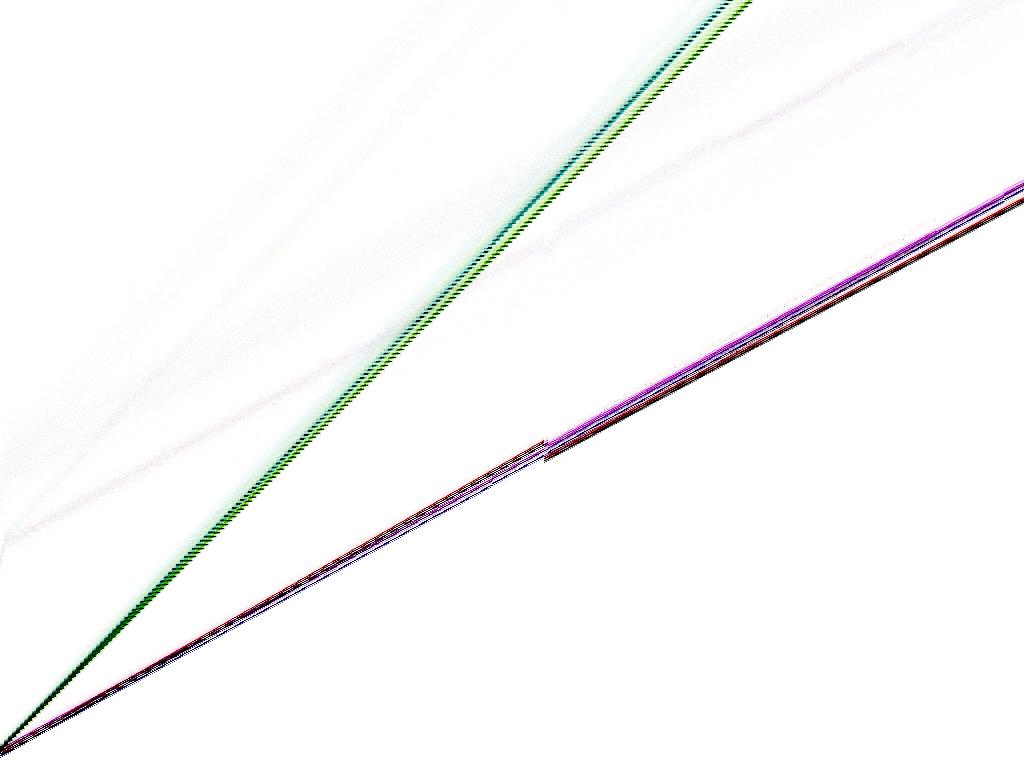
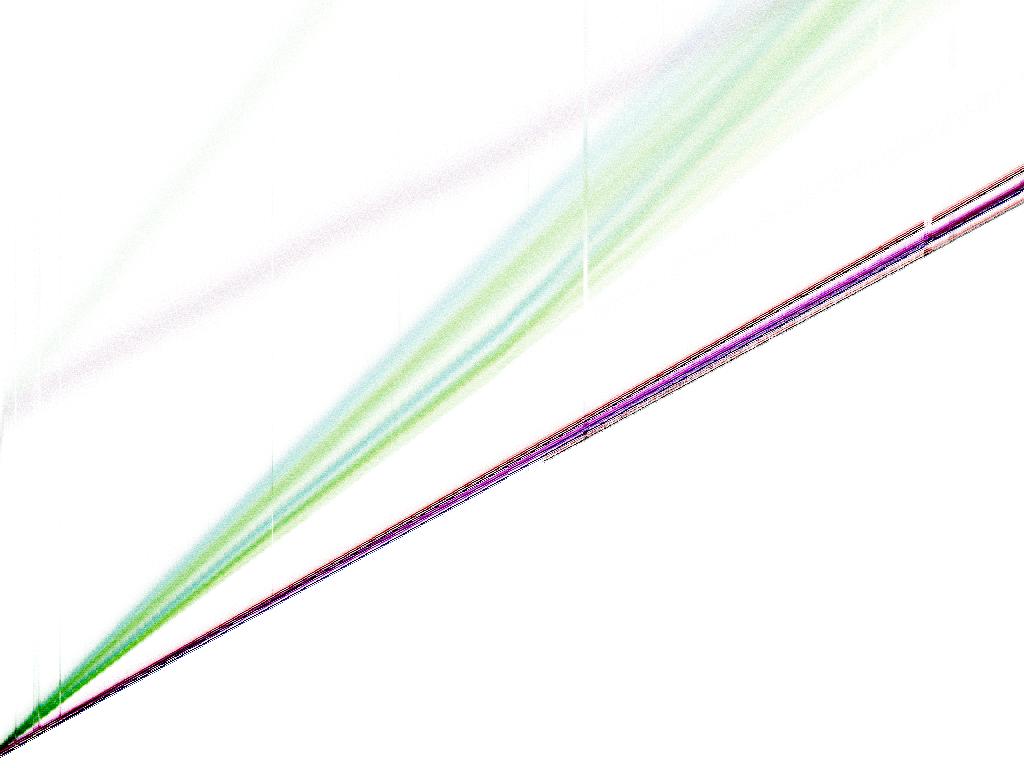
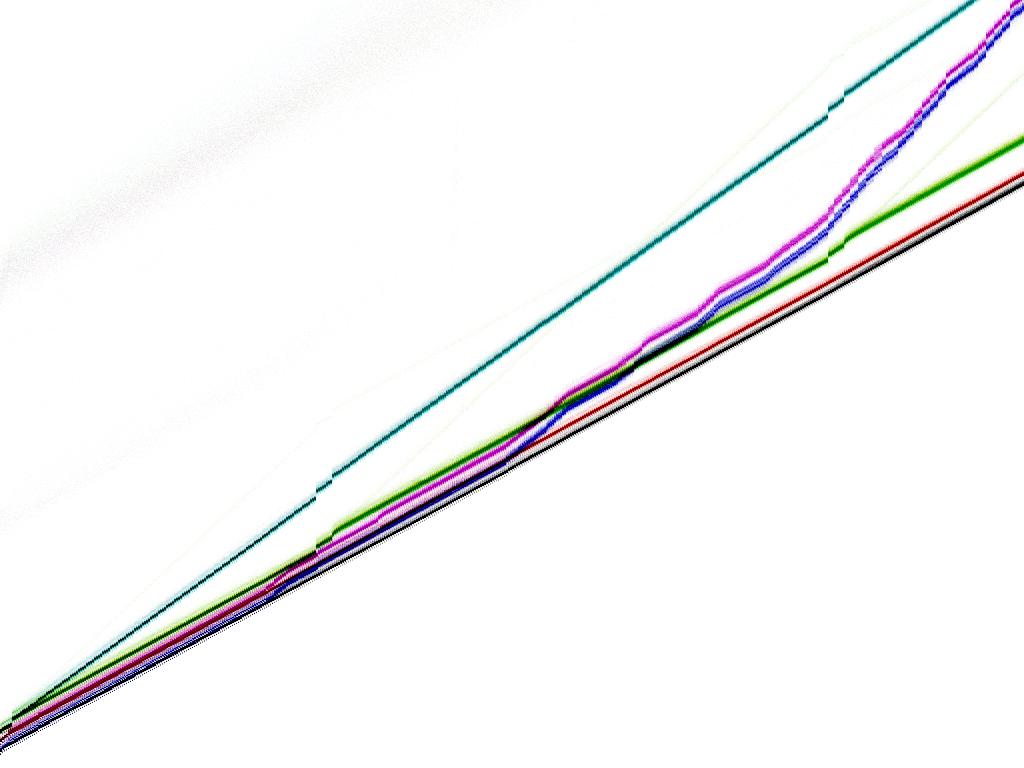
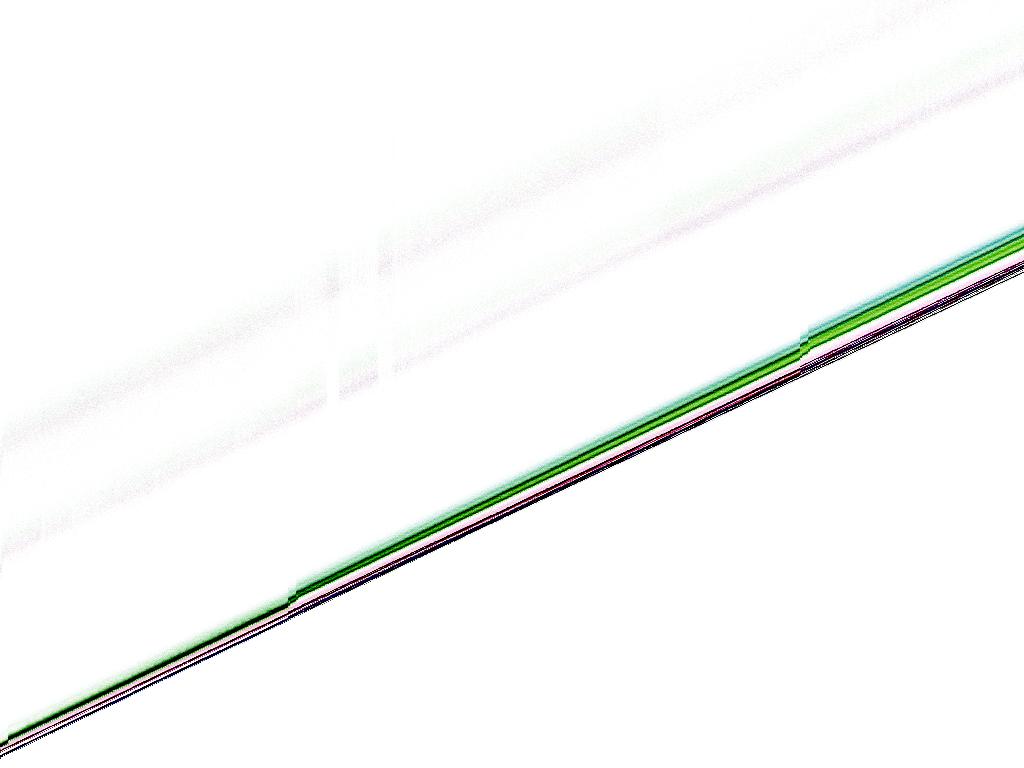
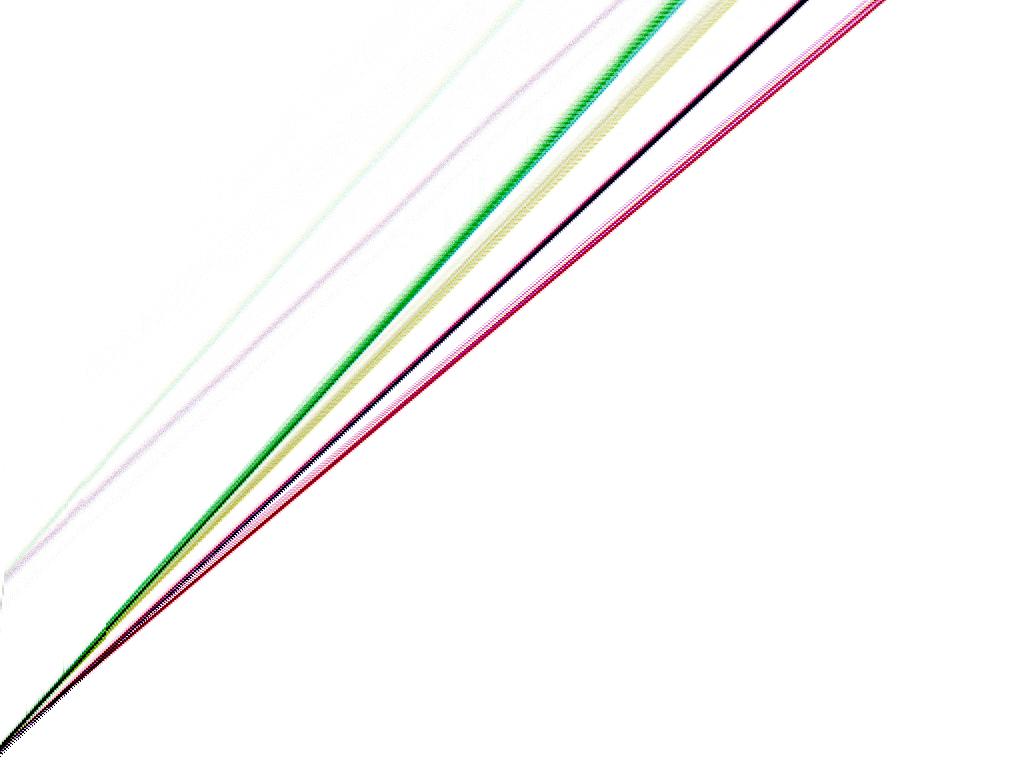
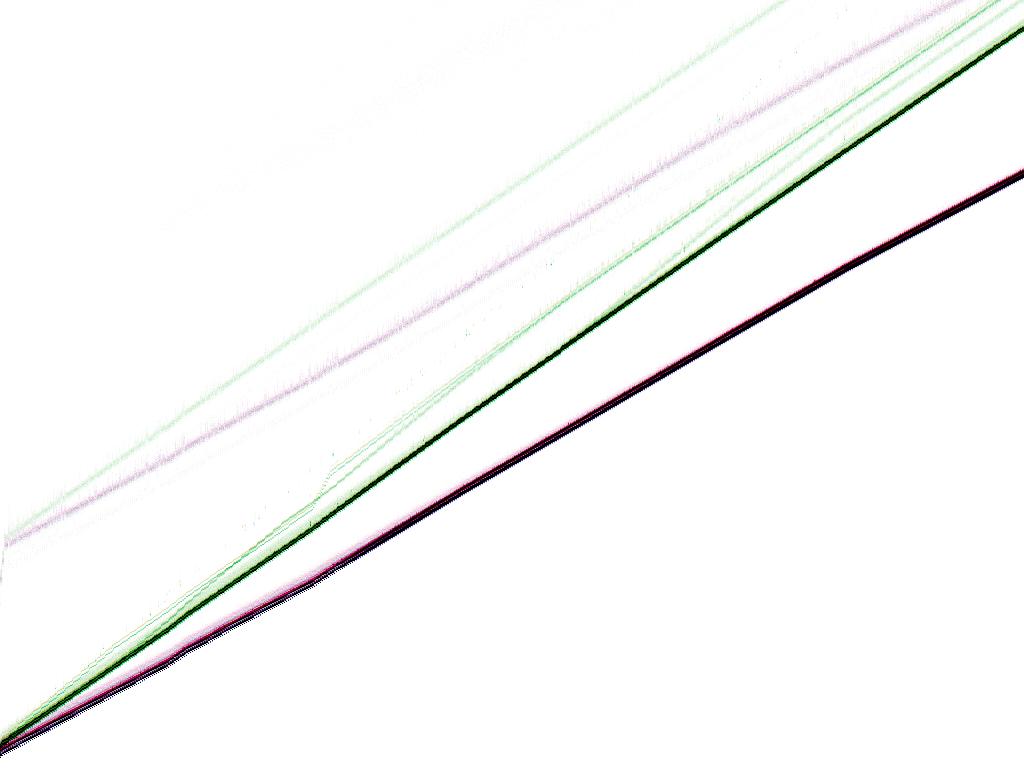
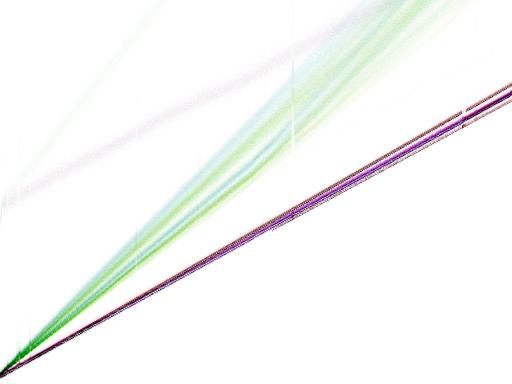
Speed graphs
The following graphs show the time to verify an authenticator
in various situations.
Color scheme:
- Non-reddish (black, green, dark blue, light blue):
Keys are in cache.
- Reddish (red, yellow, purple, gray):
Keys are not in cache.
- Non-greenish (black, red, dark blue, purple):
Messages/nonces/authenticators are in cache.
- Greenish (green, yellow, light blue, gray):
Messages/nonces/authenticators are not in cache.
- Non-blueish (black, red, green, yellow):
Keys/nonces/messages/authenticators are aligned.
- Blueish (dark blue, purple, light blue, gray):
Keys/nonces/messages/authenticators are unaligned.
The graphs include code in cache and code out of cache;
the out-of-cache case is a faint cloud above the in-cache case,
with the same color scheme.
The horizontal axis on the graphs is message length,
from 0 bytes to 8192 bytes.
The vertical axis on the graphs is time,
from 0 CPU cycles to 49152 CPU cycles.
The bottom-left-to-top-right diagonal is 6 CPU cycles per byte.
Lengths divisible by 16 are slightly faster
than lengths not divisible by 16.
The best case in (almost) every graph
is length divisible by 16,
everything in cache, everything aligned;
this case is visible as 512 black dots at the bottom of the graph.
To convert a speed table to a speed graph,
feed it through
speed-graph.sh.
AMD Athlon cpuid AuthenticAMD-00000622-0183f9ff,
900MHz,
gcc 2.95.4 -O3:
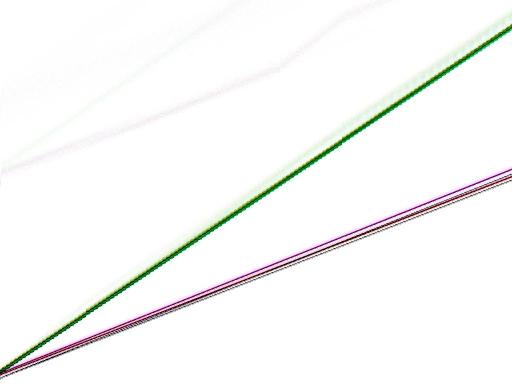
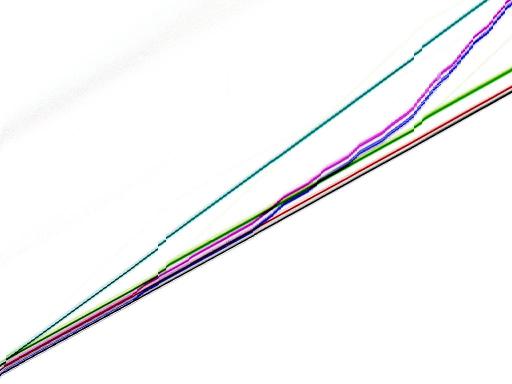
IBM PowerPC RS64 IV (Sstar),
668MHz (one of eight CPUs):
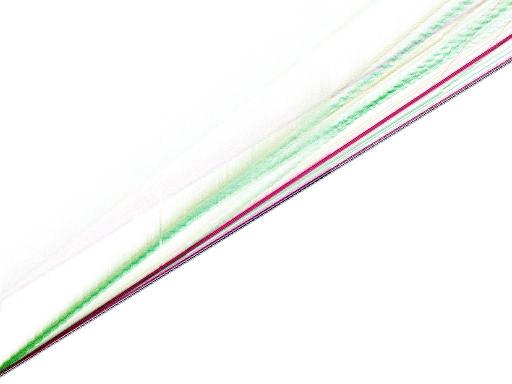
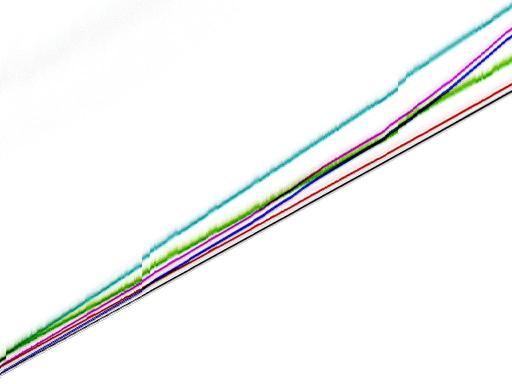
Intel Pentium III
cpuid GenuineIntel-00000673-0383fbff,
500MHz,
gcc 2.95.4 -O3 -mcpu=pentiumpro:
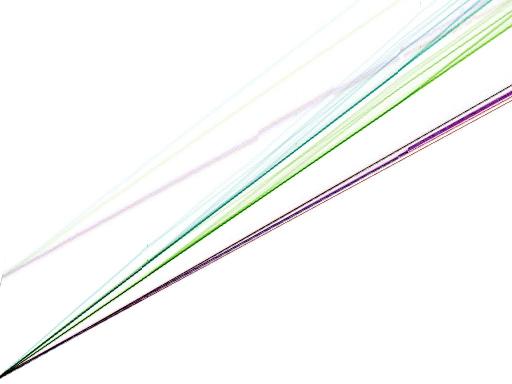
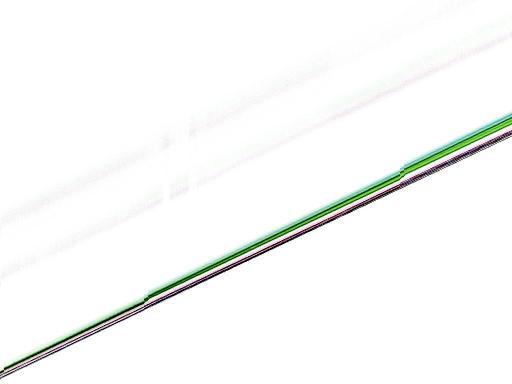
Intel Pentium III,
850MHz:

Intel Pentium III,
1000MHz (one of two CPUs):
Intel Pentium 4,
1900MHz:
Intel Pentium 4
cpuid GenuineIntel-00000f29-bfebfbff,
3400MHz,
gcc 2.95.4 -O3 -mcpu=pentiumpro:
Intel Pentium M
cpuid GenuineIntel-00000695-a7e9f9bf,
1300MHz,
gcc 2.95.4 -O1:
Motorola PowerPC 7410 (G4),
533MHz (one of two CPUs):

Sun UltraSPARC II,
296MHz (one of four CPUs):

Sun UltraSPARC IIi,
360MHz,
gcc 3.0.4 -m64 -O3 -mcpu=ultrasparc:
Sun UltraSPARC III,
900MHz (one of eight CPUs):